The Technology Adoption Curve: What It Is, Why It Matters, and What 2026 Data Tells Us
Introducing a new workplace tool often comes with high expectations. When the solution looks good and fills a real need, it's tempting to assume everyone will jump on board quickly. But when the first adoption numbers come in, they can feel deflating. Leadership might expect 80% adoption within the first month. The reality is usually very different.
This is where the technology adoption curve comes in. People don't all respond to change the same way. Some employees are naturally curious and will try any new tool the moment it shows up. Others have been burned before and stick with what works until they have no choice. Most people sit somewhere in between.
Because of that, adoption happens in stages. Hitting around 50% in the first month is actually a healthy sign. If you understand how the curve works, you can set expectations that don't set you up for disappointment and you can plan a rollout that actually accounts for how people behave.
What is the Technology Adoption Curve?
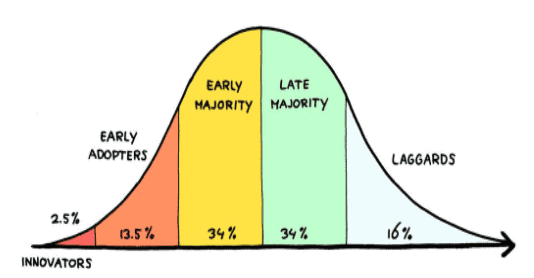
The technology adoption curve is a behavioral model that estimates how fast people will accept and start using a new technology. Sociologist Everett Rogers introduced it in 1962, and it uses psychology and sociology to break adoption into five stages along a bell-shaped curve.
It's a useful reference whenever you're rolling out a digital tool. It's especially helpful when you need to set adoption targets and explain those targets to leadership. You probably won't hit 100% adoption. You might not even get to 90%. But leadership may still want that. The curve gives you a research-backed way to show what's actually realistic, rather than getting into an argument about ambition versus how human beings actually behave.
The 5 Stages of Technology Adoption
Innovators (2.5%)
Innovators try new technology first. They're comfortable with risk and get genuinely excited about experimentation. These are the people who sign up for your beta before you've finished the landing page. Their feedback shapes early conversations about what works and what doesn't, and they're usually forgiving about bugs and rough edges.
Early Adopters (13.5%)
Early adopters pick up on value quickly, but unlike innovators, they care about their reputation. They want to form a solid opinion before they recommend something publicly. They're often opinion leaders in their organizations, and once they validate a tool, broader adoption tends to follow. Get this group on your side and they'll do half your internal marketing for you.
Early Majority (34%)
The early majority wants proof. They prefer reliable, well-tested solutions and will wait until a product has demonstrated clear benefits. They respond well to seeing the tool in action — actual use cases from colleagues, not pitch decks from vendors.
Late Majority (34%)
The late majority is skeptical. They adopt only after a technology becomes widely accepted. Social pressure, company mandates, or plain necessity usually push them over the line. These are the people hitting snooze on software update notifications for as long as they possibly can, waiting to hear how their peers react before committing.
Laggards (16%)
Laggards are last. They prefer traditional methods and usually only switch when the old system is literally no longer available. They're not necessarily uninformed — many have seen enough tools come and go that they don't see the point in jumping early.
What the Curve Looks Like in 2026
The traditional bell-curve model still applies, but the distances between adopter groups are shifting depending on the technology and the industry. A few areas worth paying attention to:
AI has moved into early-majority territory for enterprises, though unevenly.
- About 70% of businesses still place themselves in early stages of AI adoption, but 94% plan to invest in AI-specific training this year (CompTIA 2026 IT Industry Outlook)
- Worker access to AI tools rose 50% in 2025; the number of companies with 40%+ AI projects in production is expected to double within six months (Deloitte 2026 State of AI)
- Enterprise generative AI spending hit $37 billion in 2025 — more than triple the $11.5 billion spent in 2024
- AI adoption among US firms roughly doubled from 3.7% in late 2023 to 9.7% by mid-2025 (Census Bureau Business Trends survey)
- Adoption is uneven: one in four Information sector businesses use AI, while the rate in Accommodation and Food Services is about a tenth of that
Cloud and SaaS have crossed into late-majority territory.
- 94% of enterprises worldwide use cloud computing in some form
- 93% use cloud-based collaboration tools
- The SaaS market hit roughly $408 billion in 2025 and is projected to pass $1 trillion by the mid-2030s
- The average organization now runs 106 SaaS apps
- In the EU, over 52% of enterprises used paid cloud services in 2025, with nearly all (96%) purchasing at least one SaaS category
Digital collaboration tools are essentially universal for knowledge workers. The remote and hybrid work shift that started during the pandemic has fully normalized. Remaining holdouts are mainly in industries where desktop software or in-person processes are deeply embedded.
AI agents are the newest thing on the curve.
- 40% of enterprise applications will embed task-specific AI agents by 2026, up from under 5% in 2025 (Gartner)
- The AI agents market is projected to exceed $10.9 billion this year
- Customer service and eCommerce lead adoption — clearest ROI
- Over 40% of agentic AI projects risk cancellation by 2027 if governance and observability don't catch up (Gartner)
How to Use the Technology Adoption Curve
Set realistic adoption benchmarks.
Instead of expecting 80% adoption within two months, set phased goals. Target innovators and early adopters in the first few weeks. Measure early-majority engagement over the next quarter. Adjust from there based on what the data tells you. The curve won't give you exact timelines — no model will — but combined with what you know about your workforce, it helps you set targets that don't demoralize the team when the first numbers come in.
Show leadership where you stand.
Map user engagement to the adoption stages. "We've moved past innovators into the early majority" tells a clearer story than a raw percentage. It also helps leadership understand that a 40% adoption rate in month two might be exactly on track rather than a failure.
Innovators respond to pilot programs and early access. The early majority needs training, support, and evidence that the tool works. The late majority needs to see that the tool has become the standard — and that resisting it will create more friction than just using it.
How to Increase Technology Adoption
The tools that get adopted successfully tend to share a few things: a clear rollout plan, a pilot group to build momentum, real training (not just a Slack message with a link), and someone tracking whether people actually use the thing.
The ones that fail tend to get launched with a company-wide email, no onboarding, and a vague hope that the tool will sell itself. It won't.
Pay attention to feedback in the first few weeks, that's when you find out what's confusing, what's broken, and what people actually want. If the feedback loop is slow, adoption will be too.
Limitations of the Curve
The technology adoption curve is useful for planning, but don't treat it like a law of physics.
It assumes adoption follows a consistent pattern, and in practice, some technologies skip stages or stall at the chasm between early adopters and the early majority. External factors like budgets, regulations, cultural resistance can accelerate or block adoption in ways the model doesn't capture. Different industries adopt at wildly different speeds; AI adoption in the information sector is roughly ten times higher than in hospitality right now. And the model describes what happens but not always why someone adopts or refuses.
It's a planning guide, not a crystal ball.
What's Next?
If you're planning to launch a new communication platform to connect with your teams, the rollout strategy matters as much as the tool itself. Reach out to learn how EngagedlyFX and expert consultation services can help you implement and scale an internal communication solution that actually gets used.


Recent articles


Operate. Connect. Perform.
EngagedlyFX delivers actionable insights and engagement tools to reduce turnover, increase productivity and improve employee well-being.